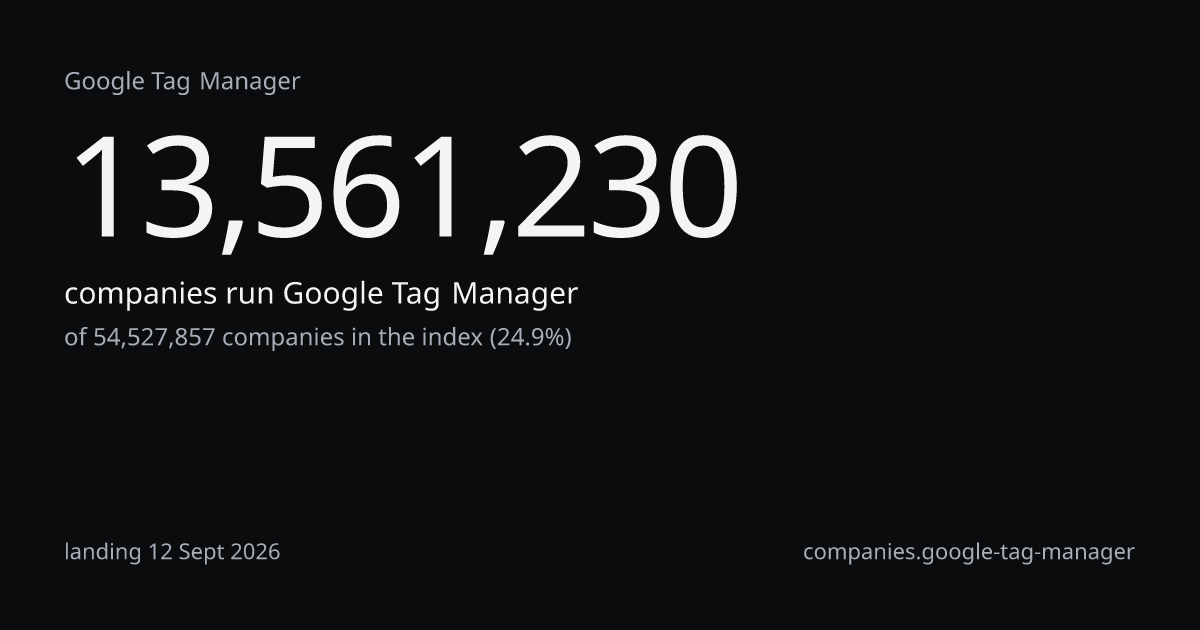
Companies, monthly, on the fixed panel of sites crawled since 2020of 54,527,857 in the indexlanding 12 Sept 2026
13,560,922 at Sept 26; 14,446,153 twelve months earlier, -885,231, -6.1% on the fixed panel; the series starts January 2021 because the panel is anchored at 31 Dec 2020
| Month | Companies | Observed on the panel |
|---|---|---|
| 2021-01 | 6,819,142 | 1,317,665 |
| 2021-02 | 6,819,175 | 1,317,671 |
| 2021-03 | 6,819,202 | 1,317,676 |
| 2021-04 | 6,819,226 | 1,317,681 |
| 2021-05 | 6,819,253 | 1,317,686 |
| 2021-06 | 6,819,282 | 1,317,692 |
| 2021-07 | 6,819,366 | 1,317,708 |
| 2021-08 | 6,820,082 | 1,317,846 |
| 2021-09 | 6,820,716 | 1,317,969 |
| 2021-10 | 6,821,324 | 1,318,086 |
| 2021-11 | 6,821,960 | 1,318,209 |
| 2021-12 | 6,822,694 | 1,318,351 |
| 2022-01 | 6,823,379 | 1,318,483 |
| 2022-02 | 6,824,062 | 1,318,615 |
| 2022-03 | 6,824,851 | 1,318,768 |
| 2022-04 | 6,825,603 | 1,318,913 |
| 2022-05 | 6,826,353 | 1,319,058 |
| 2022-06 | 6,827,135 | 1,319,209 |
| 2022-07 | 6,827,902 | 1,319,357 |
| 2022-08 | 6,828,609 | 1,319,494 |
| 2022-09 | 6,828,888 | 1,319,548 |
| 2022-10 | 6,829,200 | 1,319,608 |
| 2022-11 | 6,829,529 | 1,319,672 |
| 2022-12 | 6,829,817 | 1,319,727 |
| 2023-01 | 6,830,038 | 1,319,770 |
| 2023-02 | 6,830,294 | 1,319,819 |
| 2023-03 | 6,830,571 | 1,319,873 |
| 2023-04 | 6,926,267 | 1,338,364 |
| 2023-05 | 7,000,737 | 1,352,754 |
| 2023-06 | 7,075,207 | 1,367,144 |
| 2023-07 | 7,149,637 | 1,381,526 |
| 2023-08 | 7,224,079 | 1,395,911 |
| 2023-09 | 7,298,519 | 1,410,295 |
| 2023-10 | 7,372,789 | 1,424,646 |
| 2023-11 | 7,447,106 | 1,439,006 |
| 2023-12 | 7,521,422 | 1,453,366 |
| 2024-01 | 7,595,735 | 1,467,726 |
| 2024-02 | 7,670,081 | 1,482,092 |
| 2024-03 | 7,782,697 | 1,503,853 |
| 2024-04 | 7,890,840 | 1,524,749 |
| 2024-05 | 7,903,457 | 1,527,187 |
| 2024-06 | 7,937,699 | 1,533,804 |
| 2024-07 | 7,971,889 | 1,540,410 |
| 2024-08 | 8,014,140 | 1,548,574 |
| 2024-09 | 8,176,126 | 1,579,875 |
| 2024-10 | 8,594,996 | 1,660,813 |
| 2024-11 | 9,134,896 | 1,765,138 |
| 2024-12 | 9,664,096 | 1,867,396 |
| 2025-01 | 10,262,712 | 1,983,066 |
| 2025-02 | 10,829,792 | 2,092,643 |
| 2025-03 | 11,396,803 | 2,202,207 |
| 2025-04 | 11,942,212 | 2,307,597 |
| 2025-05 | 12,464,024 | 2,408,427 |
| 2025-06 | 13,008,908 | 2,513,715 |
| 2025-07 | 13,540,056 | 2,616,348 |
| 2025-08 | 14,069,882 | 2,718,727 |
| 2025-09 | 14,446,153 | 2,791,434 |
| 2025-10 | 14,701,707 | 2,840,815 |
| 2025-11 | 14,700,377 | 2,840,558 |
| 2025-12 | 14,578,017 | 2,816,914 |
| 2026-01 | 14,469,252 | 2,795,897 |
| 2026-02 | 14,364,986 | 2,775,750 |
| 2026-03 | 14,315,468 | 2,766,182 |
| 2026-04 | 14,244,312 | 2,752,432 |
| 2026-05 | 14,140,530 | 2,732,378 |
| 2026-06 | 14,052,455 | 2,715,359 |
| 2026-07 | 13,911,480 | 2,688,119 |
| 2026-08 | 13,756,994 | 2,658,267 |
| 2026-09 | 13,560,922 | 2,620,380 |
Shares of the same 13,561,230each row a different wholelanding 12 Sept 2026
Three wholes, three shares of one count: a share travels with its whole, never alone. Against the last of them, Google Tag Manager is rank 1 of 17 technologies in Tag managers.
Open as a segment
13,561,230 companies; add a country, a sector or a band on the segment page. Counting is free.
As recorded in the cataloguetaxonomy release tax-2026.10last discovered 10 Sept 2026
Google Tag Manager enables deployment and control of marketing and analytics tags.
Teams can add, version, and fire third-party or custom tags without editing site code. It is provided by Google with a free plan and an enterprise option within Google Analytics 360.
One click under this answer