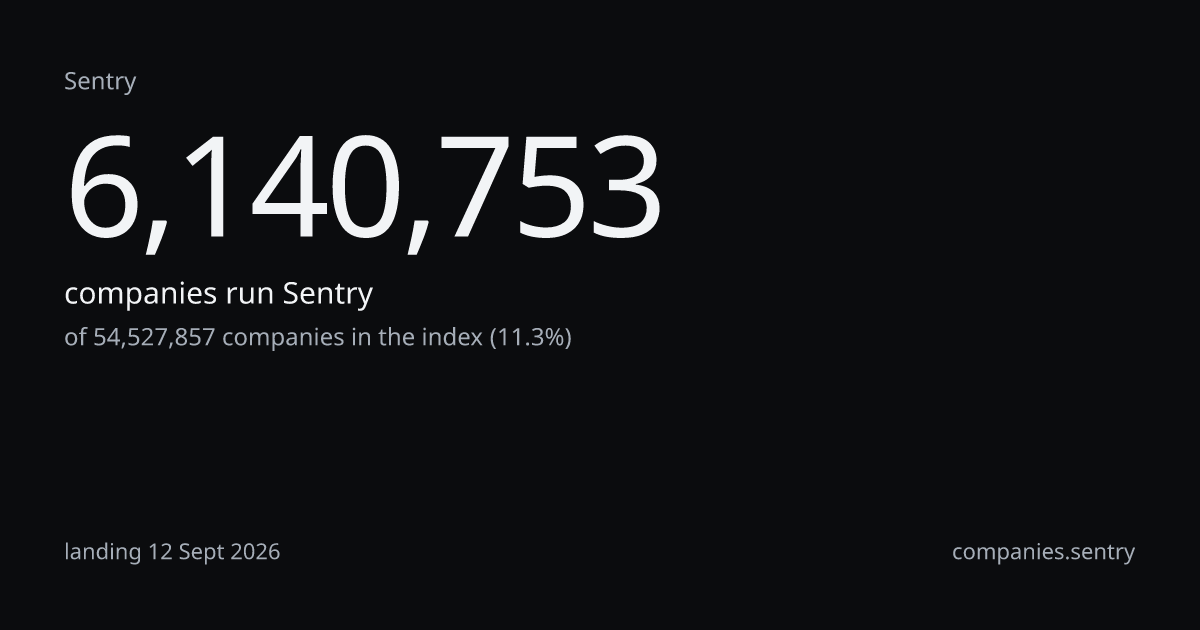
Companies, monthly, on the fixed panel of sites crawled since 2020of 54,527,857 in the indexlanding 12 Sept 2026
6,140,709 at Sept 26; 6,116,590 twelve months earlier, +24,119, +0.4% on the fixed panel; the series starts January 2021 because the panel is anchored at 31 Dec 2020
| Month | Companies | Observed on the panel |
|---|---|---|
| 2021-01 | 3,536,075 | 408,030 |
| 2021-02 | 3,536,081 | 408,030 |
| 2021-03 | 3,536,086 | 408,031 |
| 2021-04 | 3,536,090 | 408,031 |
| 2021-05 | 3,536,094 | 408,032 |
| 2021-06 | 3,536,098 | 408,032 |
| 2021-07 | 3,536,112 | 408,034 |
| 2021-08 | 3,536,311 | 408,057 |
| 2021-09 | 3,536,503 | 408,079 |
| 2021-10 | 3,536,686 | 408,100 |
| 2021-11 | 3,536,891 | 408,124 |
| 2021-12 | 3,537,131 | 408,152 |
| 2022-01 | 3,537,352 | 408,177 |
| 2022-02 | 3,537,572 | 408,203 |
| 2022-03 | 3,537,810 | 408,230 |
| 2022-04 | 3,538,046 | 408,257 |
| 2022-05 | 3,538,280 | 408,284 |
| 2022-06 | 3,538,530 | 408,313 |
| 2022-07 | 3,538,777 | 408,342 |
| 2022-08 | 3,539,014 | 408,369 |
| 2022-09 | 3,539,109 | 408,380 |
| 2022-10 | 3,539,206 | 408,391 |
| 2022-11 | 3,539,309 | 408,403 |
| 2022-12 | 3,539,392 | 408,413 |
| 2023-01 | 3,539,457 | 408,420 |
| 2023-02 | 3,539,538 | 408,429 |
| 2023-03 | 3,539,627 | 408,440 |
| 2023-04 | 3,673,763 | 423,918 |
| 2023-05 | 3,761,855 | 434,083 |
| 2023-06 | 3,849,948 | 444,248 |
| 2023-07 | 3,938,024 | 454,411 |
| 2023-08 | 4,026,103 | 464,574 |
| 2023-09 | 4,114,182 | 474,738 |
| 2023-10 | 4,202,221 | 484,897 |
| 2023-11 | 4,290,265 | 495,056 |
| 2023-12 | 4,378,310 | 505,216 |
| 2024-01 | 4,466,354 | 515,375 |
| 2024-02 | 4,554,406 | 525,536 |
| 2024-03 | 4,691,805 | 541,390 |
| 2024-04 | 4,824,202 | 556,667 |
| 2024-05 | 4,822,533 | 556,475 |
| 2024-06 | 4,867,610 | 561,676 |
| 2024-07 | 4,912,594 | 566,867 |
| 2024-08 | 4,958,345 | 572,146 |
| 2024-09 | 5,021,758 | 579,464 |
| 2024-10 | 5,125,825 | 591,472 |
| 2024-11 | 5,233,706 | 603,920 |
| 2024-12 | 5,336,087 | 615,734 |
| 2025-01 | 5,459,944 | 630,026 |
| 2025-02 | 5,575,904 | 643,407 |
| 2025-03 | 5,691,838 | 656,785 |
| 2025-04 | 5,763,207 | 665,020 |
| 2025-05 | 5,835,056 | 673,311 |
| 2025-06 | 5,916,191 | 682,673 |
| 2025-07 | 5,992,897 | 691,524 |
| 2025-08 | 6,071,168 | 700,556 |
| 2025-09 | 6,116,590 | 705,797 |
| 2025-10 | 6,144,219 | 708,985 |
| 2025-11 | 6,131,193 | 707,482 |
| 2025-12 | 6,114,354 | 705,539 |
| 2026-01 | 6,105,245 | 704,488 |
| 2026-02 | 6,136,328 | 708,074 |
| 2026-03 | 6,192,036 | 714,503 |
| 2026-04 | 6,192,051 | 714,504 |
| 2026-05 | 6,186,418 | 713,854 |
| 2026-06 | 6,185,526 | 713,751 |
| 2026-07 | 6,171,023 | 712,078 |
| 2026-08 | 6,158,957 | 710,686 |
| 2026-09 | 6,140,709 | 708,580 |
Shares of the same 6,140,753each row a different wholelanding 12 Sept 2026
Three wholes, three shares of one count: a share travels with its whole, never alone. Against the last of them, Sentry is rank 1 of 12 technologies in Error tracking.
Open as a segment
6,140,753 companies; add a country, a sector or a band on the segment page. Counting is free.
As recorded in the cataloguetaxonomy release tax-2026.10last discovered 10 Sept 2026
Application error tracking and performance monitoring platform.
Sentry provides error tracking, issues, and performance monitoring for web and mobile applications, available as SaaS or self-hosted open source. Developers and SRE teams use it to capture exceptions, traces, and alerts in production.
One click under this answer