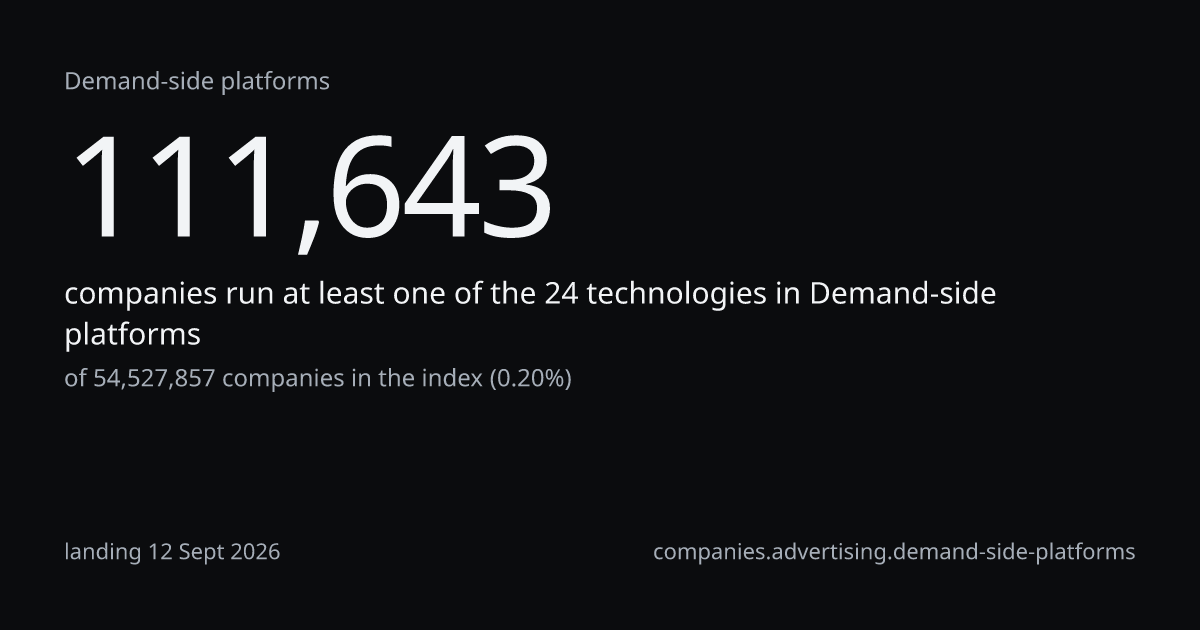
Share of companies running any technology in this subcategory, monthlyof 111,643 companies with any of themlanding 12 Sept 2026
Each month is drawn as 100%, so the bands are shares and not counts; a company running two of these technologies is counted in both, and everything past the fourth is folded into Other. The series starts January 2021 because the panel is anchored at 31 Dec 2020
| Month | theTradeDesk | Criteo | StackAdapt | Other |
|---|---|---|---|---|
| 2021-01 | 29.0% | 17.4% | 4.1% | 49.5% |
| 2021-02 | 29.0% | 17.4% | 4.1% | 49.5% |
| 2021-03 | 29.0% | 17.4% | 4.1% | 49.5% |
| 2021-04 | 29.0% | 17.4% | 4.1% | 49.5% |
| 2021-05 | 29.0% | 17.4% | 4.1% | 49.5% |
| 2021-06 | 29.0% | 17.4% | 4.1% | 49.5% |
| 2021-07 | 29.0% | 17.4% | 4.1% | 49.5% |
| 2021-08 | 29.0% | 17.4% | 4.1% | 49.5% |
| 2021-09 | 29.0% | 17.4% | 4.1% | 49.5% |
| 2021-10 | 29.0% | 17.4% | 4.1% | 49.5% |
| 2021-11 | 29.0% | 17.4% | 4.1% | 49.5% |
| 2021-12 | 29.0% | 17.4% | 4.1% | 49.5% |
| 2022-01 | 29.0% | 17.4% | 4.1% | 49.5% |
| 2022-02 | 29.0% | 17.4% | 4.1% | 49.5% |
| 2022-03 | 29.1% | 17.4% | 4.1% | 49.5% |
| 2022-04 | 29.1% | 17.4% | 4.1% | 49.5% |
| 2022-05 | 29.1% | 17.4% | 4.1% | 49.5% |
| 2022-06 | 29.1% | 17.4% | 4.1% | 49.5% |
| 2022-07 | 29.1% | 17.4% | 4.1% | 49.5% |
| 2022-08 | 29.1% | 17.4% | 4.1% | 49.5% |
| 2022-09 | 29.1% | 17.4% | 4.1% | 49.5% |
| 2022-10 | 29.1% | 17.4% | 4.1% | 49.5% |
| 2022-11 | 29.1% | 17.4% | 4.1% | 49.5% |
| 2022-12 | 29.1% | 17.4% | 4.1% | 49.5% |
| 2023-01 | 29.1% | 17.4% | 4.1% | 49.5% |
| 2023-02 | 29.1% | 17.4% | 4.1% | 49.5% |
| 2023-03 | 29.1% | 17.4% | 4.1% | 49.5% |
| 2023-04 | 29.1% | 17.4% | 4.1% | 49.5% |
| 2023-05 | 29.1% | 17.4% | 4.1% | 49.5% |
| 2023-06 | 29.1% | 17.4% | 4.1% | 49.5% |
| 2023-07 | 29.1% | 17.4% | 4.1% | 49.5% |
| 2023-08 | 29.1% | 17.4% | 4.1% | 49.5% |
| 2023-09 | 29.1% | 17.4% | 4.1% | 49.5% |
| 2023-10 | 29.1% | 17.4% | 4.1% | 49.5% |
| 2023-11 | 31.0% | 15.2% | 4.9% | 48.8% |
| 2023-12 | 31.0% | 15.2% | 4.9% | 48.8% |
| 2024-01 | 31.0% | 15.2% | 4.9% | 48.8% |
| 2024-02 | 31.0% | 15.2% | 4.9% | 48.8% |
| 2024-03 | 31.0% | 15.2% | 4.9% | 48.8% |
| 2024-04 | 31.0% | 15.2% | 4.9% | 48.8% |
| 2024-05 | 31.0% | 15.2% | 4.9% | 48.8% |
| 2024-06 | 31.0% | 15.2% | 4.9% | 48.8% |
| 2024-07 | 31.0% | 15.2% | 4.9% | 48.8% |
| 2024-08 | 31.0% | 15.2% | 4.9% | 48.8% |
| 2024-09 | 31.0% | 15.2% | 4.9% | 48.8% |
| 2024-10 | 30.0% | 15.0% | 5.3% | 49.7% |
| 2024-11 | 30.0% | 15.0% | 5.3% | 49.7% |
| 2024-12 | 30.0% | 15.0% | 5.3% | 49.7% |
| 2025-01 | 30.0% | 15.0% | 5.3% | 49.7% |
| 2025-02 | 30.0% | 15.0% | 5.3% | 49.7% |
| 2025-03 | 30.1% | 15.0% | 5.3% | 49.7% |
| 2025-04 | 30.8% | 14.1% | 5.4% | 49.6% |
| 2025-05 | 31.2% | 12.8% | 6.0% | 50.0% |
| 2025-06 | 31.6% | 12.5% | 6.1% | 49.9% |
| 2025-07 | 31.6% | 12.5% | 6.1% | 49.9% |
| 2025-08 | 31.7% | 12.5% | 6.3% | 49.5% |
| 2025-09 | 31.7% | 12.5% | 6.3% | 49.5% |
| 2025-10 | 31.7% | 12.5% | 6.3% | 49.5% |
| 2025-11 | 31.9% | 12.5% | 6.5% | 49.0% |
| 2025-12 | 31.9% | 12.5% | 6.5% | 49.0% |
| 2026-01 | 31.2% | 12.6% | 6.8% | 49.5% |
| 2026-02 | 30.6% | 12.6% | 7.0% | 49.9% |
| 2026-03 | 24.4% | 13.4% | 8.8% | 53.4% |
| 2026-04 | 24.3% | 13.4% | 8.8% | 53.4% |
| 2026-05 | 24.3% | 13.4% | 8.8% | 53.4% |
| 2026-06 | 24.3% | 13.4% | 8.8% | 53.4% |
| 2026-07 | 24.3% | 13.4% | 8.8% | 53.4% |
| 2026-08 | 24.3% | 13.4% | 8.8% | 53.4% |
| 2026-09 | 24.4% | 13.4% | 8.8% | 53.4% |
Companiesof 111,643 with any of themlanding 12 Sept 2026
17 of 24 technologiesa company running two of them is counted in both, so the shares do not sum to 100%under 20 companies no share is published
7 of the 10 most detected technologies here sit under the publication gate on detector quality of 0.90, so they are listed rather than ranked: AppNexus 21,090, Simpli.fi 20,423, Adform 7,547, Bidmatic 4,171, Aarki 3,572, Mountain 2,772, Basis Technologies 2,355.
One click under this answer