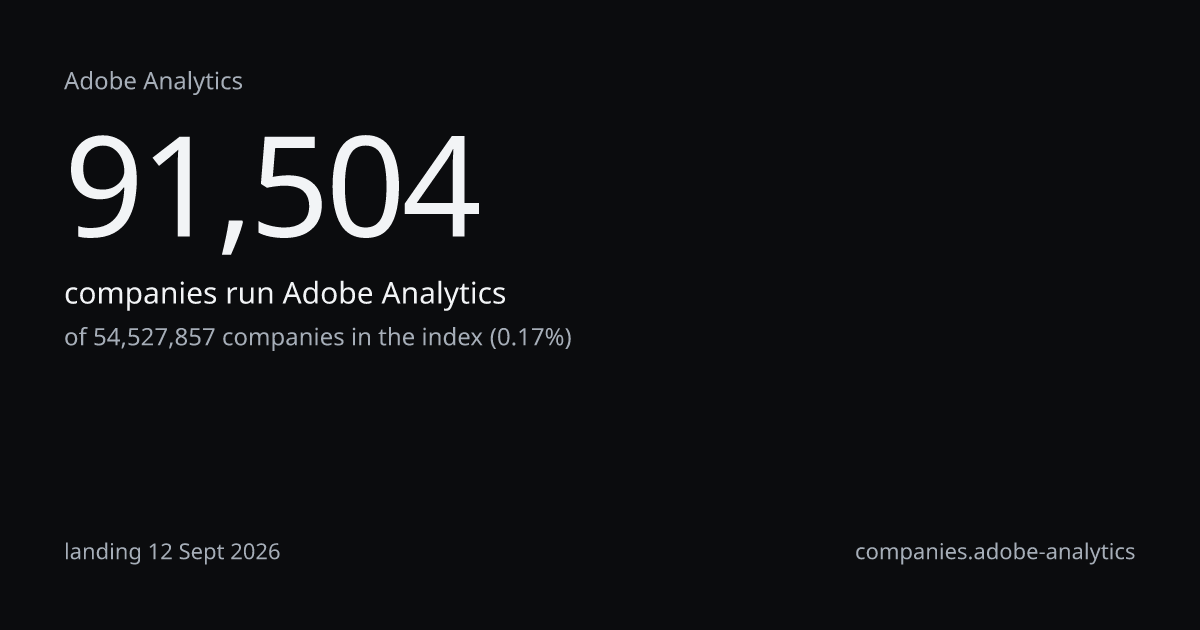
Companies, monthly, on the fixed panel of sites crawled since 2020of 54,527,857 in the indexlanding 12 Sept 2026
91,502 at Sept 26; 134,036 twelve months earlier, -42,534, -31.7% on the fixed panel; the series starts January 2021 because the panel is anchored at 31 Dec 2020
| Month | Companies | Observed on the panel |
|---|---|---|
| 2021-01 | 19,210 | 2,925 |
| 2021-02 | 19,214 | 2,925 |
| 2021-03 | 19,218 | 2,926 |
| 2021-04 | 19,220 | 2,926 |
| 2021-05 | 19,224 | 2,927 |
| 2021-06 | 19,227 | 2,927 |
| 2021-07 | 19,237 | 2,929 |
| 2021-08 | 19,316 | 2,941 |
| 2021-09 | 19,377 | 2,950 |
| 2021-10 | 19,435 | 2,959 |
| 2021-11 | 19,495 | 2,968 |
| 2021-12 | 19,563 | 2,978 |
| 2022-01 | 19,627 | 2,988 |
| 2022-02 | 19,691 | 2,998 |
| 2022-03 | 19,770 | 3,010 |
| 2022-04 | 19,846 | 3,022 |
| 2022-05 | 19,922 | 3,033 |
| 2022-06 | 20,003 | 3,045 |
| 2022-07 | 20,083 | 3,058 |
| 2022-08 | 20,157 | 3,069 |
| 2022-09 | 20,172 | 3,071 |
| 2022-10 | 20,205 | 3,076 |
| 2022-11 | 20,238 | 3,081 |
| 2022-12 | 20,267 | 3,086 |
| 2023-01 | 20,290 | 3,089 |
| 2023-02 | 20,314 | 3,093 |
| 2023-03 | 20,340 | 3,097 |
| 2023-04 | 28,114 | 4,280 |
| 2023-05 | 32,945 | 5,016 |
| 2023-06 | 37,777 | 5,752 |
| 2023-07 | 42,601 | 6,486 |
| 2023-08 | 47,426 | 7,221 |
| 2023-09 | 52,252 | 7,955 |
| 2023-10 | 57,069 | 8,689 |
| 2023-11 | 61,889 | 9,423 |
| 2023-12 | 66,708 | 10,156 |
| 2024-01 | 71,528 | 10,890 |
| 2024-02 | 76,368 | 11,627 |
| 2024-03 | 89,537 | 13,632 |
| 2024-04 | 99,235 | 15,108 |
| 2024-05 | 101,169 | 15,403 |
| 2024-06 | 106,073 | 16,150 |
| 2024-07 | 110,973 | 16,896 |
| 2024-08 | 116,121 | 17,679 |
| 2024-09 | 121,728 | 18,533 |
| 2024-10 | 128,407 | 19,550 |
| 2024-11 | 133,452 | 20,318 |
| 2024-12 | 138,293 | 21,055 |
| 2025-01 | 143,687 | 21,876 |
| 2025-02 | 148,078 | 22,545 |
| 2025-03 | 152,446 | 23,210 |
| 2025-04 | 148,733 | 22,645 |
| 2025-05 | 146,274 | 22,270 |
| 2025-06 | 144,065 | 21,934 |
| 2025-07 | 141,353 | 21,521 |
| 2025-08 | 138,583 | 21,099 |
| 2025-09 | 134,036 | 20,407 |
| 2025-10 | 128,993 | 19,639 |
| 2025-11 | 122,877 | 18,708 |
| 2025-12 | 118,395 | 18,026 |
| 2026-01 | 114,131 | 17,376 |
| 2026-02 | 109,546 | 16,678 |
| 2026-03 | 106,037 | 16,144 |
| 2026-04 | 103,197 | 15,712 |
| 2026-05 | 99,549 | 15,156 |
| 2026-06 | 98,051 | 14,928 |
| 2026-07 | 95,862 | 14,595 |
| 2026-08 | 93,903 | 14,297 |
| 2026-09 | 91,502 | 13,931 |
Shares of the same 91,504each row a different wholelanding 12 Sept 2026
Three wholes, three shares of one count: a share travels with its whole, never alone. Against the last of them, Adobe Analytics is rank 15 of 198 technologies in Web analytics platforms.
Open as a segment
91,504 companies; add a country, a sector or a band on the segment page. Counting is free.
As recorded in the cataloguetaxonomy release tax-2026.10last discovered 10 Sept 2026
Adobe Analytics is an enterprise web analytics platform for measuring site and app behaviour.
Part of Adobe Experience Cloud, Adobe Analytics collects and analyses digital customer behaviour, reporting on traffic, conversions, and segments. It is used by large organisations for advanced analysis and reporting across web and mobile properties.
One click under this answer