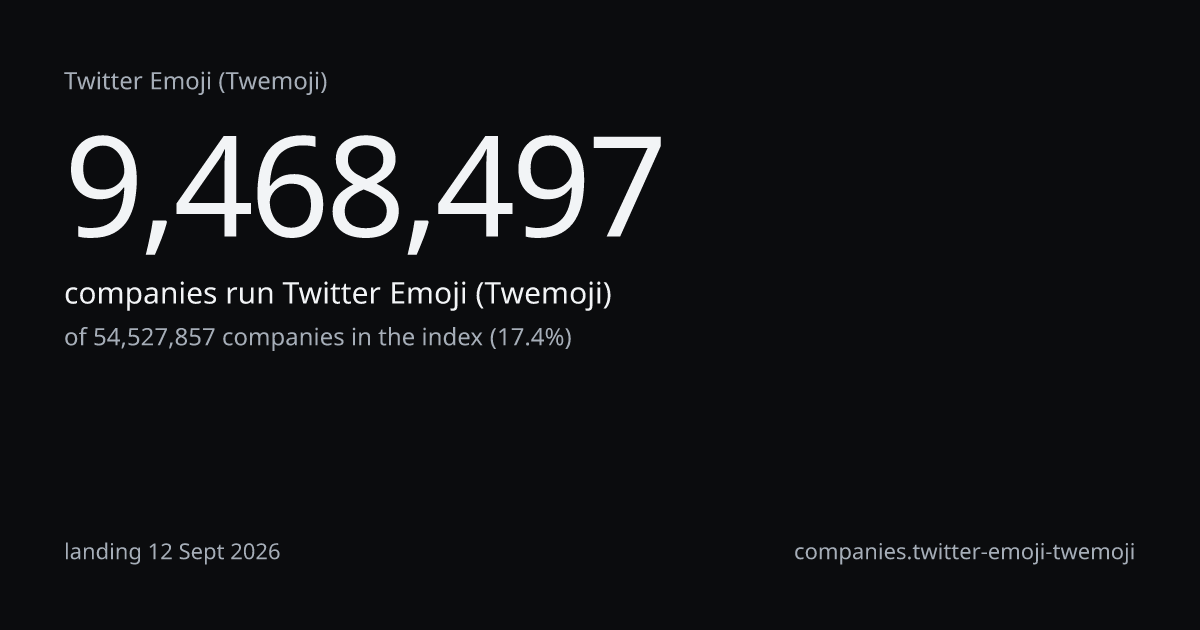
Companies, monthly, on the fixed panel of sites crawled since 2020of 54,527,857 in the indexlanding 12 Sept 2026
9,468,445 at Sept 26; 10,797,282 twelve months earlier, -1,328,837, -12.3% on the fixed panel; the series starts January 2021 because the panel is anchored at 31 Dec 2020
| Month | Companies | Observed on the panel |
|---|---|---|
| 2021-01 | 8,482,377 | 1,292,624 |
| 2021-02 | 8,482,388 | 1,292,625 |
| 2021-03 | 8,482,395 | 1,292,626 |
| 2021-04 | 8,482,402 | 1,292,627 |
| 2021-05 | 8,482,412 | 1,292,629 |
| 2021-06 | 8,482,421 | 1,292,630 |
| 2021-07 | 8,482,452 | 1,292,635 |
| 2021-08 | 8,482,788 | 1,292,686 |
| 2021-09 | 8,483,027 | 1,292,723 |
| 2021-10 | 8,483,245 | 1,292,756 |
| 2021-11 | 8,483,479 | 1,292,792 |
| 2021-12 | 8,483,752 | 1,292,833 |
| 2022-01 | 8,483,980 | 1,292,868 |
| 2022-02 | 8,484,208 | 1,292,903 |
| 2022-03 | 8,484,467 | 1,292,942 |
| 2022-04 | 8,484,713 | 1,292,980 |
| 2022-05 | 8,484,959 | 1,293,017 |
| 2022-06 | 8,485,224 | 1,293,057 |
| 2022-07 | 8,485,482 | 1,293,097 |
| 2022-08 | 8,485,718 | 1,293,133 |
| 2022-09 | 8,485,734 | 1,293,135 |
| 2022-10 | 8,485,814 | 1,293,147 |
| 2022-11 | 8,485,912 | 1,293,162 |
| 2022-12 | 8,485,991 | 1,293,174 |
| 2023-01 | 8,486,039 | 1,293,182 |
| 2023-02 | 8,486,126 | 1,293,195 |
| 2023-03 | 8,486,223 | 1,293,210 |
| 2023-04 | 8,536,102 | 1,300,811 |
| 2023-05 | 8,556,211 | 1,303,875 |
| 2023-06 | 8,576,320 | 1,306,940 |
| 2023-07 | 8,596,407 | 1,310,001 |
| 2023-08 | 8,616,498 | 1,313,062 |
| 2023-09 | 8,636,590 | 1,316,124 |
| 2023-10 | 8,656,605 | 1,319,174 |
| 2023-11 | 8,676,653 | 1,322,229 |
| 2023-12 | 8,696,701 | 1,325,284 |
| 2024-01 | 8,716,748 | 1,328,339 |
| 2024-02 | 8,736,789 | 1,331,393 |
| 2024-03 | 8,763,043 | 1,335,394 |
| 2024-04 | 8,786,818 | 1,339,017 |
| 2024-05 | 8,760,776 | 1,335,049 |
| 2024-06 | 8,764,589 | 1,335,630 |
| 2024-07 | 8,768,374 | 1,336,207 |
| 2024-08 | 8,772,391 | 1,336,819 |
| 2024-09 | 8,830,053 | 1,345,606 |
| 2024-10 | 9,010,926 | 1,373,169 |
| 2024-11 | 9,235,130 | 1,407,335 |
| 2024-12 | 9,446,966 | 1,439,617 |
| 2025-01 | 9,708,162 | 1,479,420 |
| 2025-02 | 9,862,064 | 1,502,873 |
| 2025-03 | 10,015,963 | 1,526,326 |
| 2025-04 | 10,165,396 | 1,549,098 |
| 2025-05 | 10,305,419 | 1,570,436 |
| 2025-06 | 10,462,964 | 1,594,444 |
| 2025-07 | 10,612,336 | 1,617,207 |
| 2025-08 | 10,759,418 | 1,639,620 |
| 2025-09 | 10,797,282 | 1,645,390 |
| 2025-10 | 10,780,634 | 1,642,853 |
| 2025-11 | 10,640,776 | 1,621,541 |
| 2025-12 | 10,457,586 | 1,593,624 |
| 2026-01 | 10,288,474 | 1,567,854 |
| 2026-02 | 10,110,998 | 1,540,808 |
| 2026-03 | 10,054,157 | 1,532,146 |
| 2026-04 | 9,996,353 | 1,523,337 |
| 2026-05 | 9,925,979 | 1,512,613 |
| 2026-06 | 9,856,975 | 1,502,098 |
| 2026-07 | 9,747,327 | 1,485,388 |
| 2026-08 | 9,623,432 | 1,466,508 |
| 2026-09 | 9,468,445 | 1,442,890 |
Shares of the same 9,468,497each row a different wholelanding 12 Sept 2026
Three wholes, three shares of one count: a share travels with its whole, never alone. Against the last of them, Twitter Emoji (Twemoji) is rank 2 of 9 technologies in Icon and illustration libraries.
Open as a segment
9,468,497 companies; add a country, a sector or a band on the segment page. Counting is free.
As recorded in the cataloguetaxonomy release tax-2026.10last discovered 10 Sept 2026
Open-source emoji artwork and JavaScript helpers originally from Twitter.
Twemoji provides an open-source emoji set and optional JS utilities to render emoji consistently across platforms. Developers include the assets in their sites or apps to display standardized emoji graphics.
One click under this answer