No published series
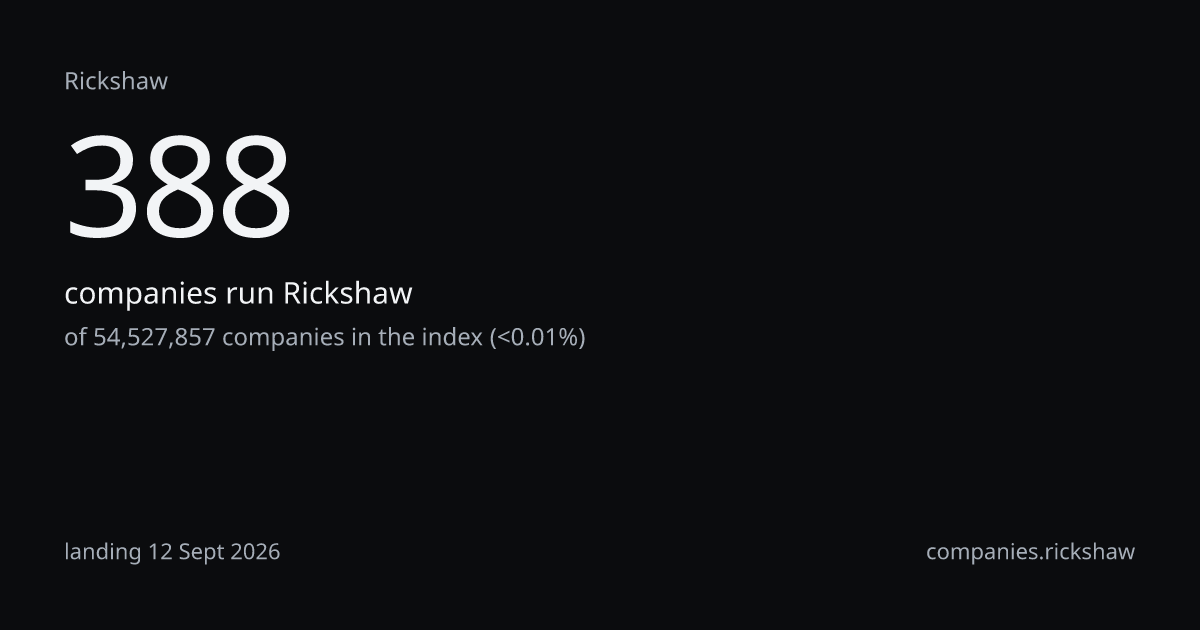
388 companies is under the publication floor of 1,000, and the fixed panel anchored at 31 Dec 2020 carries 167 of them. A monthly line drawn off that many observations would be noise at the same weight as a line off millions, so this page states the count and its date and publishes no series.
First discovered 25 Oct 2019, last discovered 10 Sept 2026.
Shares of the same 388each row a different wholelanding 12 Sept 2026
Three wholes, three shares of one count: a share travels with its whole, never alone. Against the last of them, Rickshaw is rank 39 of 58 technologies in Charting and visualization libraries.
Open as a segment
388 companies; add a country, a sector or a band on the segment page. Counting is free.
As recorded in the cataloguetaxonomy release tax-2026.10last discovered 10 Sept 2026
Open-source JavaScript charting library built on D3.
Rickshaw is a client-side visualization library that provides time-series charts using D3.js. It’s maintained as an open-source project originally by Shutterstock and used by developers to embed charts in web apps.
One click under this answer