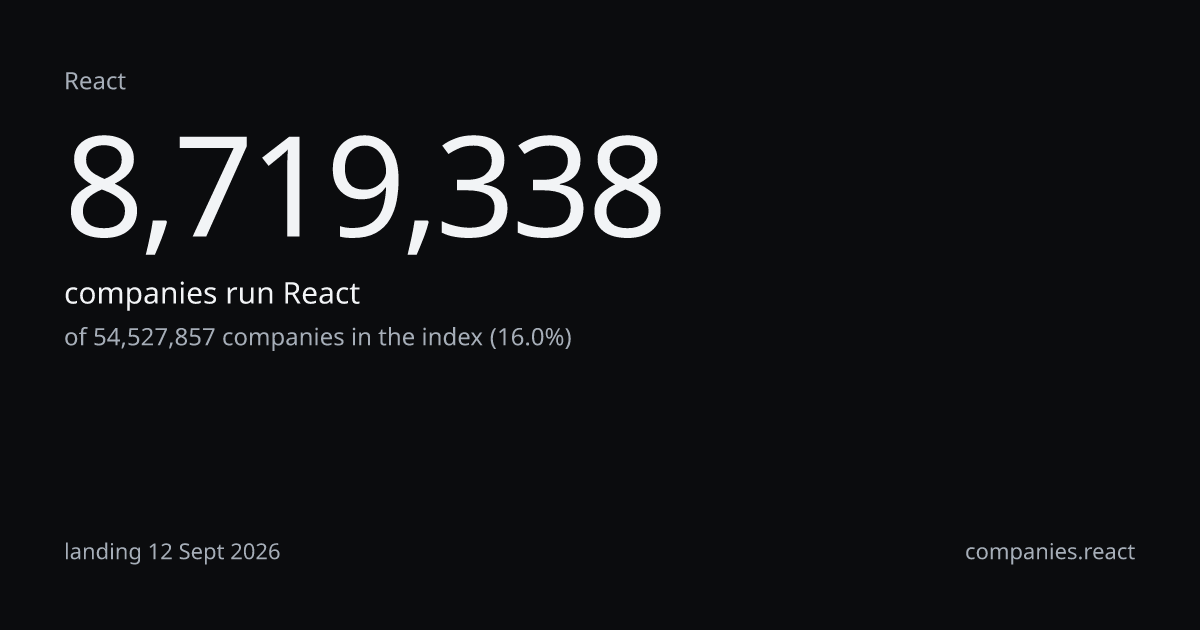
Companies, monthly, on the fixed panel of sites crawled since 2020of 54,527,857 in the indexlanding 12 Sept 2026
8,719,273 at Sept 26; 8,394,960 twelve months earlier, +324,313, +3.9% on the fixed panel; the series starts January 2021 because the panel is anchored at 31 Dec 2020
| Month | Companies | Observed on the panel |
|---|---|---|
| 2021-01 | 4,395,977 | 455,933 |
| 2021-02 | 4,396,005 | 455,936 |
| 2021-03 | 4,396,025 | 455,938 |
| 2021-04 | 4,396,042 | 455,940 |
| 2021-05 | 4,396,057 | 455,942 |
| 2021-06 | 4,396,071 | 455,943 |
| 2021-07 | 4,396,098 | 455,946 |
| 2021-08 | 4,396,765 | 456,015 |
| 2021-09 | 4,397,246 | 456,065 |
| 2021-10 | 4,397,687 | 456,111 |
| 2021-11 | 4,398,143 | 456,158 |
| 2021-12 | 4,398,659 | 456,212 |
| 2022-01 | 4,399,120 | 456,259 |
| 2022-02 | 4,399,581 | 456,307 |
| 2022-03 | 4,400,114 | 456,363 |
| 2022-04 | 4,400,624 | 456,415 |
| 2022-05 | 4,401,132 | 456,468 |
| 2022-06 | 4,401,672 | 456,524 |
| 2022-07 | 4,402,202 | 456,579 |
| 2022-08 | 4,402,717 | 456,632 |
| 2022-09 | 4,402,692 | 456,630 |
| 2022-10 | 4,402,827 | 456,644 |
| 2022-11 | 4,402,994 | 456,661 |
| 2022-12 | 4,403,139 | 456,676 |
| 2023-01 | 4,403,242 | 456,687 |
| 2023-02 | 4,403,392 | 456,703 |
| 2023-03 | 4,403,547 | 456,719 |
| 2023-04 | 4,540,241 | 470,896 |
| 2023-05 | 4,641,031 | 481,349 |
| 2023-06 | 4,741,822 | 491,803 |
| 2023-07 | 4,842,581 | 502,253 |
| 2023-08 | 4,943,349 | 512,705 |
| 2023-09 | 5,044,116 | 523,156 |
| 2023-10 | 5,144,808 | 533,599 |
| 2023-11 | 5,245,526 | 544,045 |
| 2023-12 | 5,346,244 | 554,491 |
| 2024-01 | 5,446,954 | 564,937 |
| 2024-02 | 5,547,724 | 575,388 |
| 2024-03 | 5,711,001 | 592,323 |
| 2024-04 | 5,863,739 | 608,164 |
| 2024-05 | 5,879,865 | 609,836 |
| 2024-06 | 5,933,000 | 615,347 |
| 2024-07 | 5,986,010 | 620,845 |
| 2024-08 | 6,041,396 | 626,590 |
| 2024-09 | 6,138,351 | 636,646 |
| 2024-10 | 6,315,910 | 655,061 |
| 2024-11 | 6,511,646 | 675,362 |
| 2024-12 | 6,700,105 | 694,909 |
| 2025-01 | 6,926,325 | 718,371 |
| 2025-02 | 7,138,022 | 740,328 |
| 2025-03 | 7,349,634 | 762,275 |
| 2025-04 | 7,515,273 | 779,455 |
| 2025-05 | 7,679,790 | 796,518 |
| 2025-06 | 7,869,352 | 816,178 |
| 2025-07 | 8,052,742 | 835,199 |
| 2025-08 | 8,247,401 | 855,388 |
| 2025-09 | 8,394,960 | 870,692 |
| 2025-10 | 8,500,583 | 881,647 |
| 2025-11 | 8,525,603 | 884,242 |
| 2025-12 | 8,532,445 | 884,952 |
| 2026-01 | 8,549,689 | 886,740 |
| 2026-02 | 8,611,898 | 893,192 |
| 2026-03 | 8,714,105 | 903,793 |
| 2026-04 | 8,734,852 | 905,945 |
| 2026-05 | 8,739,836 | 906,461 |
| 2026-06 | 8,760,970 | 908,653 |
| 2026-07 | 8,750,624 | 907,580 |
| 2026-08 | 8,745,963 | 907,097 |
| 2026-09 | 8,719,273 | 904,329 |
Shares of the same 8,719,338each row a different wholelanding 12 Sept 2026
Three wholes, three shares of one count: a share travels with its whole, never alone. Against the last of them, React is rank 1 of 32 technologies in Component-based UI frameworks.
Open as a segment
8,719,338 companies; add a country, a sector or a band on the segment page. Counting is free.
As recorded in the cataloguetaxonomy release tax-2026.10last discovered 10 Sept 2026
Open-source JavaScript library for creating user interfaces.
React is a component-based UI library for the web, created by Meta and maintained with an open-source community. Front-end developers use it to build interactive interfaces and single-page apps.
One click under this answer