Companies, monthly, on the fixed panel of sites crawled since 2020of 54,527,857 in the indexlanding 12 Sept 2026
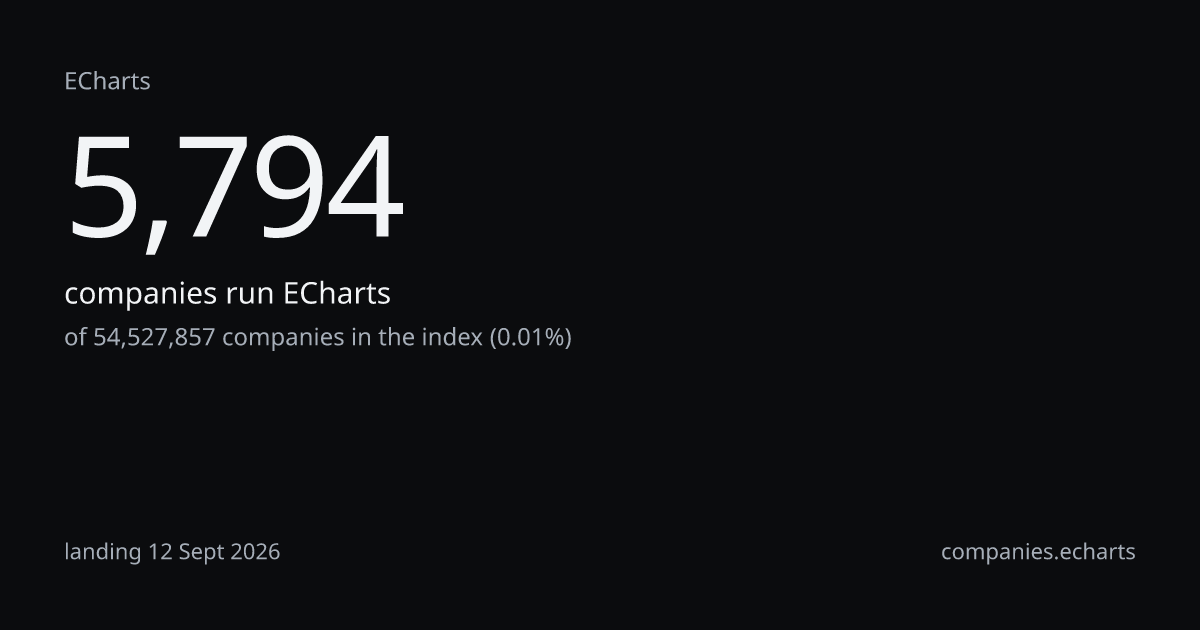
5,794 at Sept 26; 5,650 twelve months earlier, +144, +2.5% on the fixed panel; the series starts January 2021 because the panel is anchored at 31 Dec 2020
| Month | Companies | Observed on the panel |
|---|---|---|
| 2021-01 | 0 | 0 |
| 2021-02 | 0 | 0 |
| 2021-03 | 0 | 0 |
| 2021-04 | 0 | 0 |
| 2021-05 | 0 | 0 |
| 2021-06 | 0 | 0 |
| 2021-07 | 0 | 0 |
| 2021-08 | 0 | 0 |
| 2021-09 | 0 | 0 |
| 2021-10 | 0 | 0 |
| 2021-11 | 0 | 0 |
| 2021-12 | 0 | 0 |
| 2022-01 | 0 | 0 |
| 2022-02 | 0 | 0 |
| 2022-03 | 0 | 0 |
| 2022-04 | 0 | 0 |
| 2022-05 | 0 | 0 |
| 2022-06 | 0 | 0 |
| 2022-07 | 0 | 0 |
| 2022-08 | 0 | 0 |
| 2022-09 | 0 | 0 |
| 2022-10 | 0 | 0 |
| 2022-11 | 0 | 0 |
| 2022-12 | 0 | 0 |
| 2023-01 | 0 | 0 |
| 2023-02 | 0 | 0 |
| 2023-03 | 0 | 0 |
| 2023-04 | 89 | 11 |
| 2023-05 | 154 | 19 |
| 2023-06 | 219 | 27 |
| 2023-07 | 284 | 35 |
| 2023-08 | 349 | 42 |
| 2023-09 | 414 | 50 |
| 2023-10 | 479 | 58 |
| 2023-11 | 544 | 66 |
| 2023-12 | 610 | 74 |
| 2024-01 | 675 | 82 |
| 2024-02 | 742 | 90 |
| 2024-03 | 816 | 99 |
| 2024-04 | 889 | 108 |
| 2024-05 | 873 | 106 |
| 2024-06 | 882 | 107 |
| 2024-07 | 891 | 108 |
| 2024-08 | 900 | 109 |
| 2024-09 | 988 | 120 |
| 2024-10 | 1,304 | 159 |
| 2024-11 | 1,676 | 204 |
| 2024-12 | 2,042 | 248 |
| 2025-01 | 2,450 | 298 |
| 2025-02 | 2,850 | 347 |
| 2025-03 | 3,249 | 395 |
| 2025-04 | 3,653 | 444 |
| 2025-05 | 4,054 | 493 |
| 2025-06 | 4,476 | 545 |
| 2025-07 | 4,886 | 594 |
| 2025-08 | 5,302 | 645 |
| 2025-09 | 5,650 | 687 |
| 2025-10 | 5,918 | 720 |
| 2025-11 | 5,960 | 725 |
| 2025-12 | 5,944 | 723 |
| 2026-01 | 5,937 | 722 |
| 2026-02 | 5,960 | 725 |
| 2026-03 | 6,006 | 731 |
| 2026-04 | 6,003 | 730 |
| 2026-05 | 5,983 | 728 |
| 2026-06 | 5,965 | 726 |
| 2026-07 | 5,914 | 719 |
| 2026-08 | 5,866 | 714 |
| 2026-09 | 5,794 | 705 |
Shares of the same 5,794each row a different wholelanding 12 Sept 2026
Three wholes, three shares of one count: a share travels with its whole, never alone. Against the last of them, ECharts is rank 21 of 58 technologies in Charting and visualization libraries.
Open as a segment
5,794 companies; add a country, a sector or a band on the segment page. Counting is free.
As recorded in the cataloguetaxonomy release tax-2026.10last discovered 10 Sept 2026
Open-source JavaScript charting and visualization library.
Apache ECharts is an open-source JavaScript library for interactive charts and visualizations in web applications. It is a project of the Apache Software Foundation and is used by developers to embed data visualizations in sites and apps.
One click under this answer