Segment answer
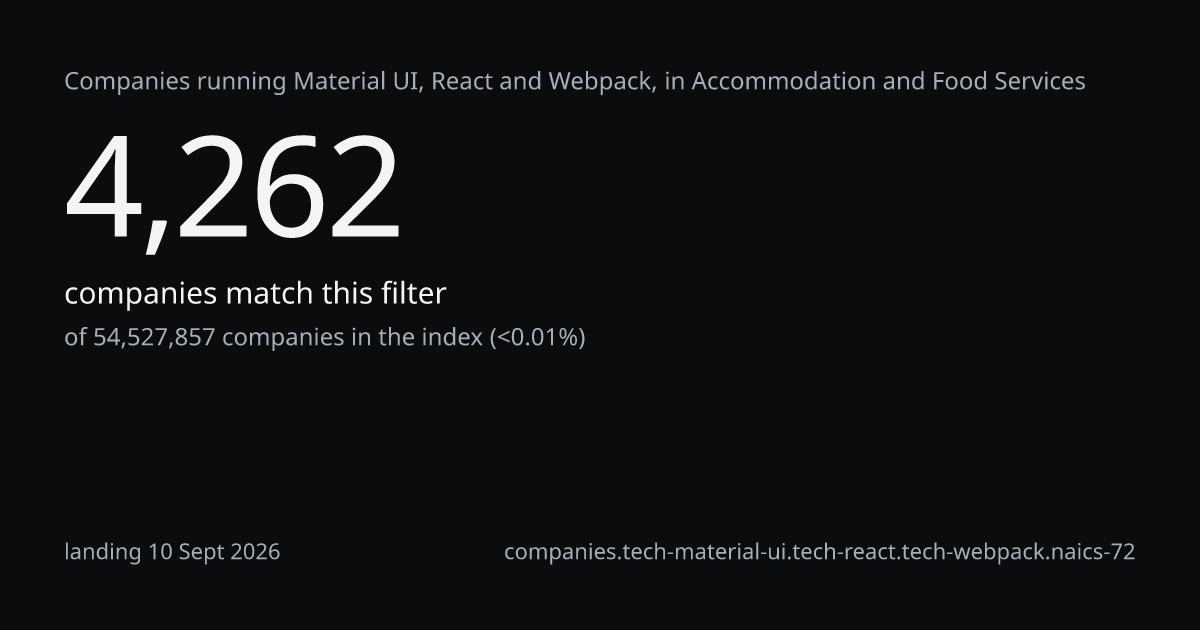
4,262
companies, <0.01% of 54,527,857 in the index. Landing 10 Sept 2026.
8 of 10 buckets a dimensionof 4,262 companies in this segmentlanding 10 Sept 2026/method/segment-facetsfacets.tech-material-ui.tech-react.tech-webpack.naics-72
Companiesof 4,262 in this segment
1 of 24 sectors; the remainder is the last row
| Sector | Companies | Share |
|---|---|---|
| 72 Accommodation and Food Services | 4,262 | 100.0% |
Companiesof 4,262 in this segment
The 8 largest categories; the remainder is the last row
| Business category | Companies | Share |
|---|---|---|
| Pizza & Italian Restaurants | 590 | 13.8% |
| Restaurants | 574 | 13.5% |
| Hotels | 365 | 8.6% |
| Fast food Restaurants | 357 | 8.4% |
| Indian Restaurants | 325 | 7.6% |
| Food delivery | 274 | 6.4% |
| Japanese & Sushi Restaurants | 254 | 6.0% |
| Inns | 209 | 4.9% |
| Middle Eastern Restaurants | 201 | 4.7% |
| Asian Restaurants | 145 | 3.4% |
| All other categories | 1,314 | 30.8% |
Companiesof 4,262 in this segment
3 of 4 bands: the decades every page and every company on this site uses1 bucket holds under 20 companies and is folded into the remainder
| Band | Companies | Share |
|---|---|---|
| 1 to 10 | 2,617 | 61.4% |
| 10 to 100 | 1,449 | 34.0% |
| 100 to 1,000 | 45 | 1.1% |
| 1 other bands, and unknown | 151 | 3.5% |
Companiesof 4,262 in this segment
Last verified, against landing 10 Sept 2026: within 30 days, 90, a year, past a year. The four add to the segment
| Tier | Companies | Share |
|---|---|---|
| fresh | 3,870 | 90.8% |
| recent | 342 | 8.0% |
| aging | 50 | 1.2% |
| stale | 0 | 0% |
Companiesof 4,262 in this segment
The 8 largest countries the count returns; the remainder is the last row
| Country | Companies | Share |
|---|---|---|
| Germany | 832 | 19.5% |
| the United States | 560 | 13.1% |
| the United Kingdom | 524 | 12.3% |
| India | 447 | 10.5% |
| France | 227 | 5.3% |
| Brazil | 146 | 3.4% |
| Russia | 132 | 3.1% |
| Pakistan | 126 | 3.0% |
| Australia | 93 | 2.2% |
| Belgium | 80 | 1.9% |
| All other countries, and unknown | 1,268 | 29.8% |
Companiesof 4,262 in this segment
The 8 most often alongside; these overlap and do not add up
| Technology | Companies | Share |
|---|---|---|
| Next.js | 3,449 | 80.9% |
| Emotion | 3,155 | 74.0% |
| PHP | 3,087 | 72.4% |
| Schannel | 2,805 | 65.8% |
| MUI | 2,425 | 56.9% |
| Google Analytics | 2,284 | 53.6% |
| Google Font API | 1,997 | 46.9% |
| Amazon Web Services | 1,926 | 45.2% |
| Vercel | 1,760 | 41.3% |
| MySQL | 1,728 | 40.5% |
9 rows shownof 4,262 companies in this segmentlanding 10 Sept 2026/method/segment-rowsrows.tech-material-ui.tech-react.tech-webpack.naics-72
9 rows of 4,262, by cursor. Ordered by the day the matched technology was first verified, most recent first. Freshness is at landing, 10 Sept 2026.
Counting is free and keyless. A free key opens 100 named rows on one filter; past that, 1 credit per 25. The CSV needs Starter, 79 USD a month.