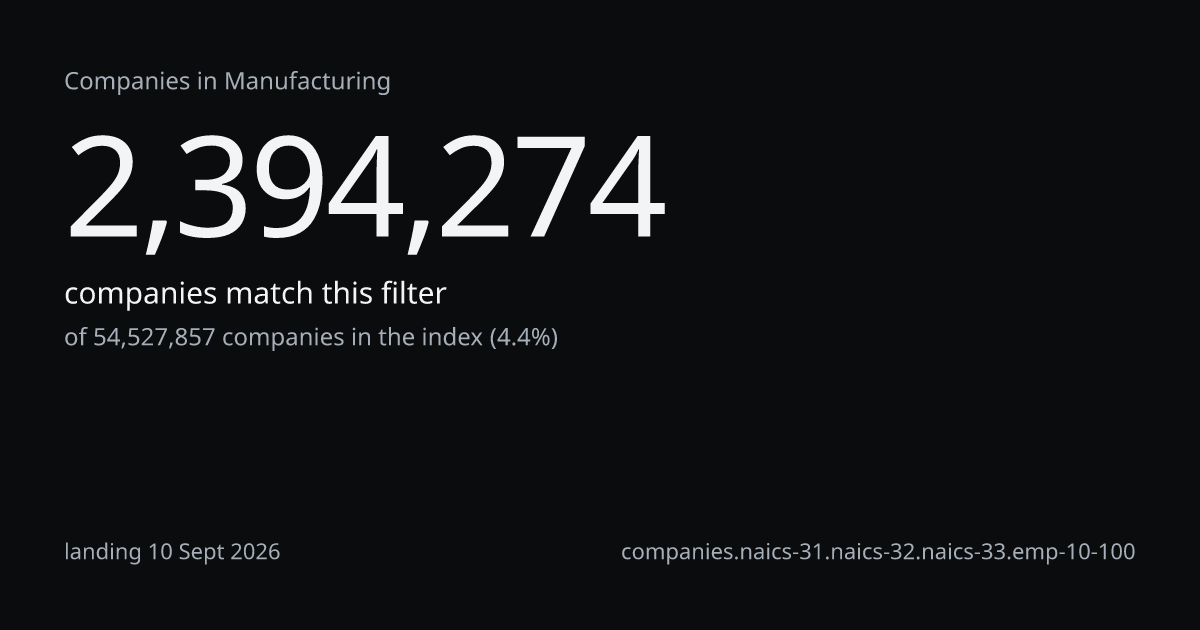
8 of 10 buckets a dimensionof 2,394,274 companies in this segmentlanding 10 Sept 2026/method/segment-facetsfacets.naics-31.naics-32.naics-33.emp-10-100
Companiesof 2,394,274 in this segment
3 of 24 sectors; the remainder is the last row
| Sector | Companies | Share |
|---|---|---|
| 33 Manufacturing | 1,306,916 | 54.6% |
| 32 Manufacturing | 659,716 | 27.6% |
| 31 Manufacturing | 427,642 | 17.9% |
Companiesof 2,394,274 in this segment
The 8 largest categories; the remainder is the last row
| Business category | Companies | Share |
|---|---|---|
| Industrial Machinery & Supplies | 170,155 | 7.1% |
| Metal Fabrication Services | 130,706 | 5.5% |
| Plastics Products | 103,166 | 4.3% |
| Building Material Manufacturers | 94,076 | 3.9% |
| Electronical Components Manufacturing | 77,522 | 3.2% |
| Clothing Manufacturers | 75,551 | 3.2% |
| Chemicals | 72,575 | 3.0% |
| Food Production | 71,260 | 3.0% |
| Commercial Printing | 66,381 | 2.8% |
| Medical Supply Manufacturers | 62,254 | 2.6% |
| All other categories | 1,599,263 | 66.8% |
Fixed to 10 to 100 employees by this segment
2,394,274 of 2,394,274. Remove the filter to see the top 10 bands, with the remainder drawn.
Companiesof 2,394,274 in this segment
Last verified, against landing 10 Sept 2026: within 30 days, 90, a year, past a year. The four add to the segment
| Tier | Companies | Share |
|---|---|---|
| fresh | 1,853,637 | 77.4% |
| recent | 194,043 | 8.1% |
| aging | 116,368 | 4.9% |
| stale | 230,226 | 9.6% |
Companiesof 2,394,274 in this segment
The 8 largest countries the count returns; the remainder is the last row
| Country | Companies | Share |
|---|---|---|
| China | 362,114 | 15.1% |
| the United States | 291,151 | 12.2% |
| India | 196,938 | 8.2% |
| Russia | 132,776 | 5.5% |
| Türkiye | 106,515 | 4.4% |
| Germany | 84,231 | 3.5% |
| Italy | 84,031 | 3.5% |
| Japan | 74,562 | 3.1% |
| Brazil | 71,034 | 3.0% |
| the United Kingdom | 58,400 | 2.4% |
| All other countries, and unknown | 1,061,956 | 44.4% |
Companiesof 2,394,274 in this segment
The 8 most often alongside; these overlap and do not add up
| Technology | Companies | Share |
|---|---|---|
| PHP | 1,502,012 | 62.7% |
| jQuery | 1,483,015 | 61.9% |
| jQuery Easing | 1,391,019 | 58.1% |
| MySQL | 1,128,036 | 47.1% |
| WordPress | 1,103,288 | 46.1% |
| Google Font API | 877,689 | 36.7% |
| jQuery Migrate | 673,004 | 28.1% |
| core-js | 644,999 | 26.9% |
| Google Analytics | 644,493 | 26.9% |
| Schannel | 639,423 | 26.7% |
9 rows shownof 2,394,274 companies in this segmentlanding 10 Sept 2026/method/segment-rowsrows.naics-31.naics-32.naics-33.emp-10-100
9 rows of 2,394,274, by cursor. Ordered by the day the matched technology was first verified, most recent first. Freshness is at landing, 10 Sept 2026.
Counting is free and keyless. A free key opens 100 named rows on one filter; past that, 1 credit per 25. The CSV needs Starter, 79 USD a month.